
As we have explained in previous articles, digital analytics is essential to make informed decisions in your digital marketing and sales strategies. However, to ensure data reliability, you must make sure internal traffic does not distort your reports.
Why is it important to filter internal traffic in HubSpot?
If you don't exclude your own visits and internal tests, reports may show inaccurate data that lead to wrong conclusions. For example, you might think that ebook downloads are decreasing when, in reality, your tests are skewing the results.
Excluding internal traffic helps you to:
- Obtain real and reliable data.
- Make better marketing decisions.
- Optimize your strategy based on true information.
How to exclude internal tests in HubSpot?
Filtering internal traffic is very simple. Just follow these steps:
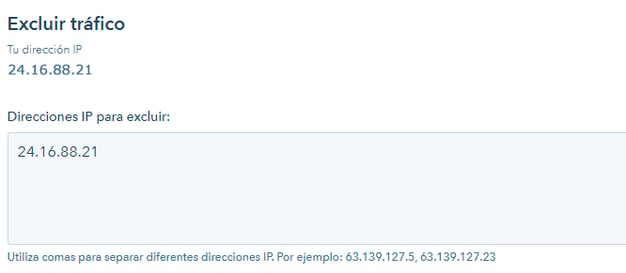
Settings > Reports > Tracking Code > Advanced Tracking
Here you can add your IP address to the exclusion field. HubSpot automatically detects your IP, so just copy, paste, and save the changes.
From that moment on, your visits won’t affect your metrics.
Two important points to keep in mind:
- IP type: If your connection uses a dynamic IP (which changes often), review this setting before conducting new tests.
- Teamwork: If multiple people modify this section simultaneously, changes might overwrite each other. Coordinate well.
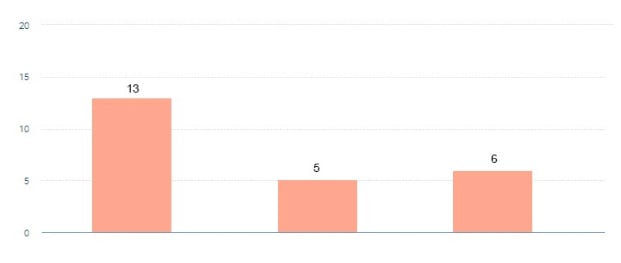
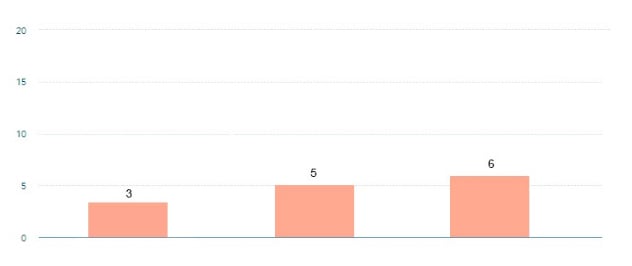
See the difference: filtered data vs unfiltered data
Without filtering internal traffic, metrics may falsely appear to rise or fall, confusing your strategy.
When internal traffic is excluded, data accurately reflects real user behavior.
Want to optimize your HubSpot management and analytics?
If you have questions about correctly setting up HubSpot or interpreting your data, we’re here to help.

Final tip to ensure reliable reports
Testing (forms, automations, workflows...) is essential to improve your platform. But remember, excluding internal visits is crucial to prevent your data from being skewed.
Regularly check that your IP is excluded to ensure your decisions are based on clean, reliable data that truly represent your real audience.

")


